


West Texas Intermediate peaked near A$145 a barrel on 17 June, the day the United States struck Iran, then settled near A$102 after the 26 June ceasefire. From a June start of about A$127, that round trip left crude roughly 20 percent cheaper on the month. The VN-Index rose 4.8 percent in June, from 1,775 to 1,860 points. Sydney’s S&P/ASX 200 managed 0.6 percent, from 8,720 to 8,776. Set both indices to 100 on 1 June and the month ends with Vietnam 4.2 percentage points ahead, a gap built while the two markets faced one war, one Federal Reserve and one barrel. June was a natural experiment, and the variable it isolated was structure.
The starting points were not symmetrical. Vietnam entered June at 1,775, about 8 percent below the all-time high of 1,936.55 set in mid-May, still carrying a trailing 12-month gain of 31 percent (HOSE). Australia entered at 8,720, inside a 52-week range of 8,262 to 9,203, having closed its financial year up roughly 3 percent (S&P Dow Jones Indices). One market arrived hot, one arrived flat. Neither chose what came next.
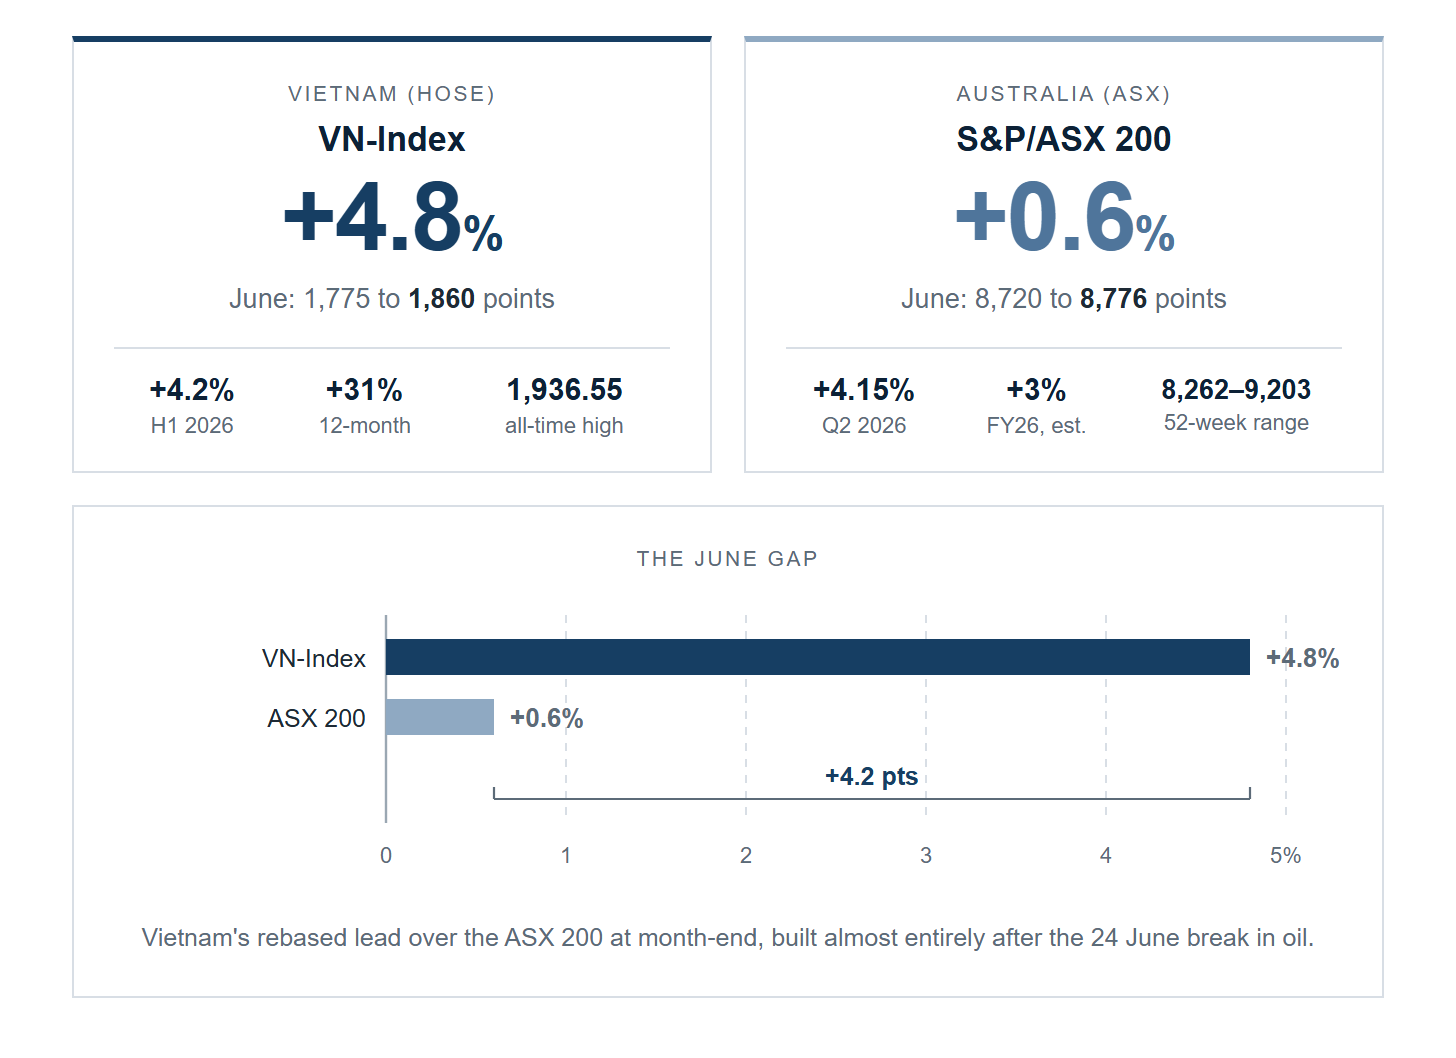
June 2026 headline numbers for both indices. The 4.2-point rebased gap is the number to explain. Sources: HOSE, S&P Dow Jones Indices.
1. Six shocks landed in one month and four ran through oil
The sequence was external from start to finish. On 4 June, Middle-East tensions flared and crude began climbing on risk to the Strait of Hormuz, the conduit for roughly a fifth of the world’s oil. Foreign outflows surged across Asia on 10 June, handing the VN-Index its sharpest dip of the month before the domestic retail bid limited the damage. Two days later SpaceX listed on the Nasdaq, the largest IPO on record at a valuation of A$2.7 trillion. Within the week an AI-capex reckoning dragged the Magnificent Seven down by high single digits, a sell-off the tech-light ASX watched from the sidelines. On 17 June the United States struck Iran, WTI spiked toward A$145, and a hawkish Federal Reserve meeting the same week strengthened the dollar against the commodity complex that anchors Sydney’s index.
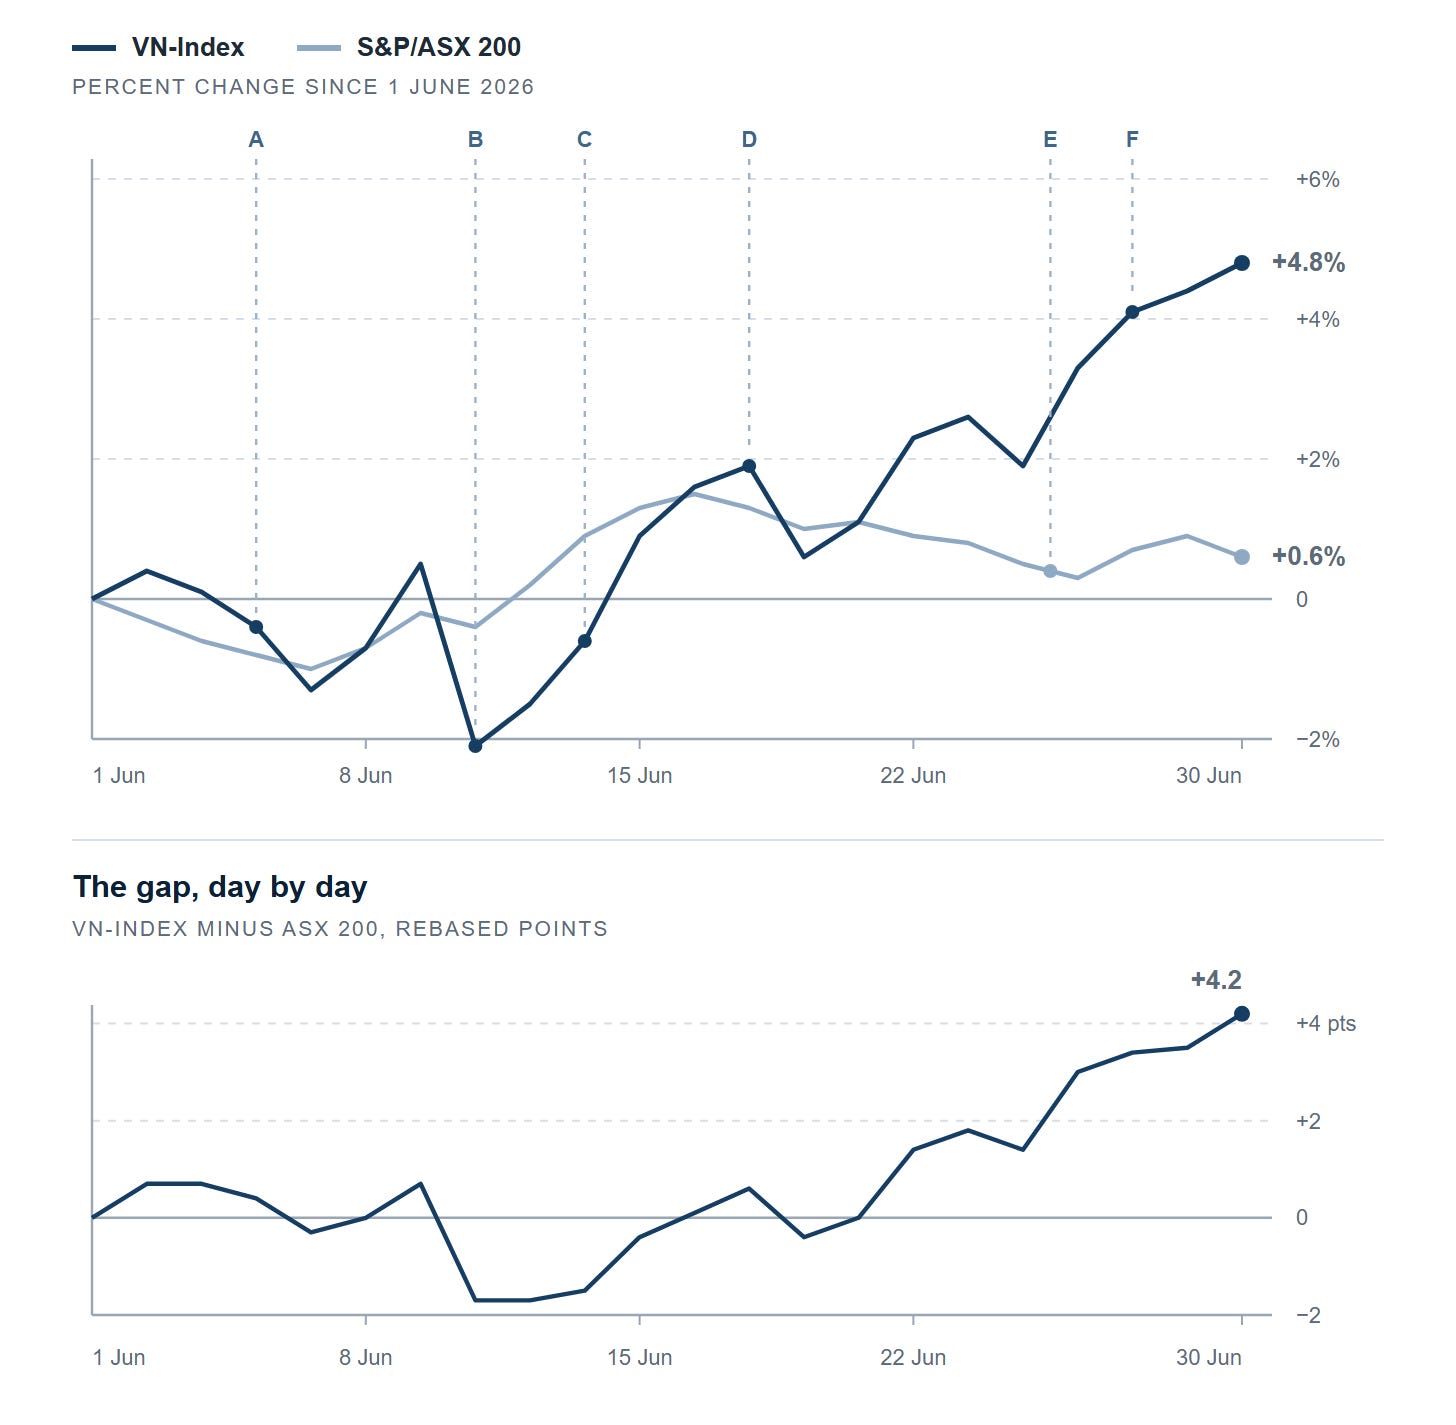
Both indices rebased to 100. Vietnam pulled away only after the 24 June break in oil. Sources: HOSE, S&P Dow Jones Indices.
By mid-month the experiment was paying the producer. The gap had gone negative twice, Vietnam absorbing the war premium as the higher-beta market. Then the hinge. Oil broke lower on 24 June, ASX materials fell a sixth straight session, and two profit warnings compounded it.
Worley dropped 10 percent on a Middle-East earnings hit of about A$91 million and Judo Capital fell 38 percent on rising bad loans (company disclosures). Micron’s results lifted Nasdaq futures 2 percent that week, and little of it reached the ASX. The 26 June ceasefire, with plans to reopen Hormuz, settled crude near A$102, and Vietnam carried the relief rally to the 1,860 close. The finishing gap was built almost entirely in the final week. Four of the six shocks ran through oil.
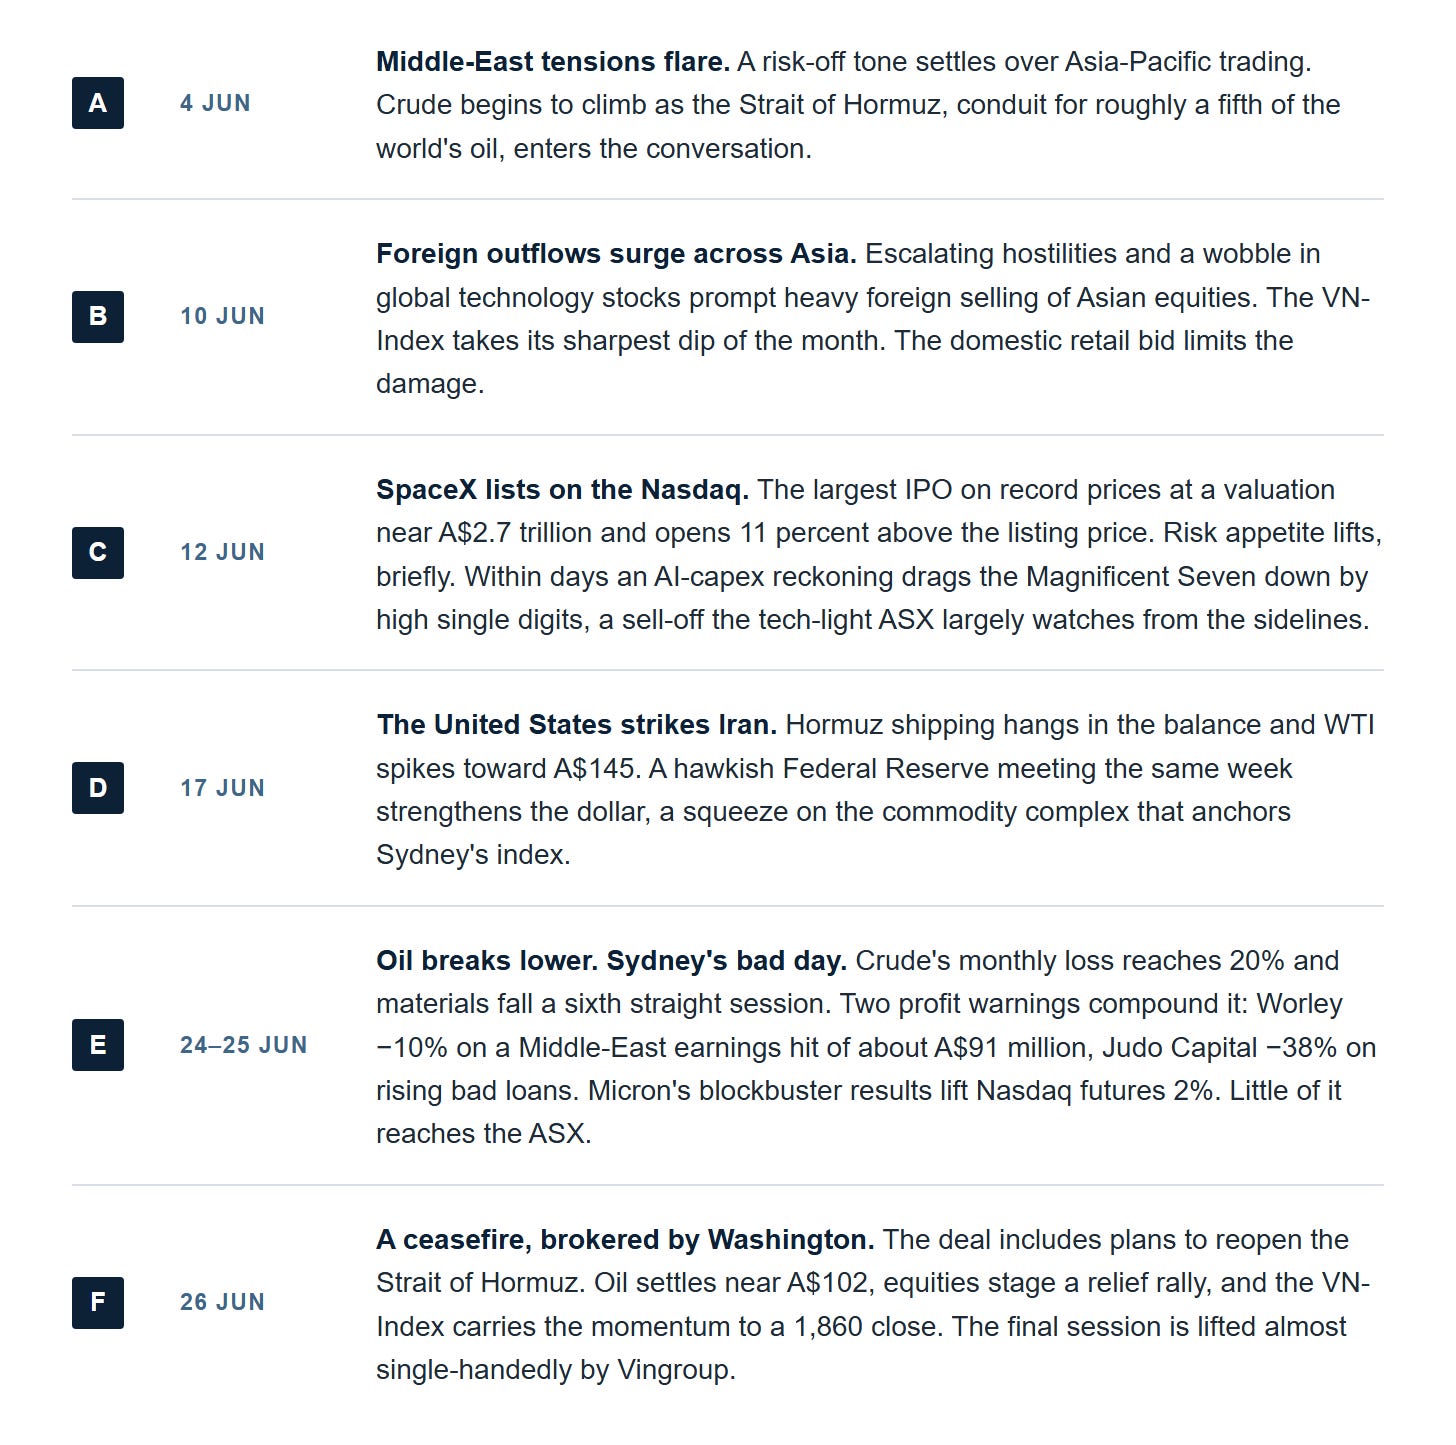
The six shocks of June 2026, markers A to F on the chart above. Every one of them is external. Sources: HOSE, ASX, Nasdaq, EIA.
2. The round trip taxed the producer and rebated the importer
Energy and materials are the ASX 200’s two largest cyclical complexes, and June marked both down: Energy −8.9%, Materials −6.7% (S&P Dow Jones Indices). Worley’s project hit made the exposure concrete, and the firmer post-FOMC dollar pressed the same complex from the currency side.
Vietnam sits on the other side of the same trade. The country is a net crude importer, so cheaper oil eases the import bill and the pressure on the State Bank of Vietnam’s 4.5 percent inflation target, held through the wartime price risk. Listed oil and gas names, BSR, PVS and PLX, fell with the price but carry a small weight in a consumer- and property-led index. Sydney’s index earns from the barrel. Ho Chi Minh City burns it. The identical shock arrived as a tax in one market and a rebate in the other.
The two non-oil shocks washed out for different reasons. The 10 June outflow wave met the depth of Vietnam’s local buyers, and the AI reckoning that followed SpaceX largely bypassed the tech-light ASX while finding little to bite on in a consumer-led VN-Index. The post-FOMC dollar cut both ways: it pressed Sydney through the commodity complex and Vietnam through foreign selling that the same local money absorbed.
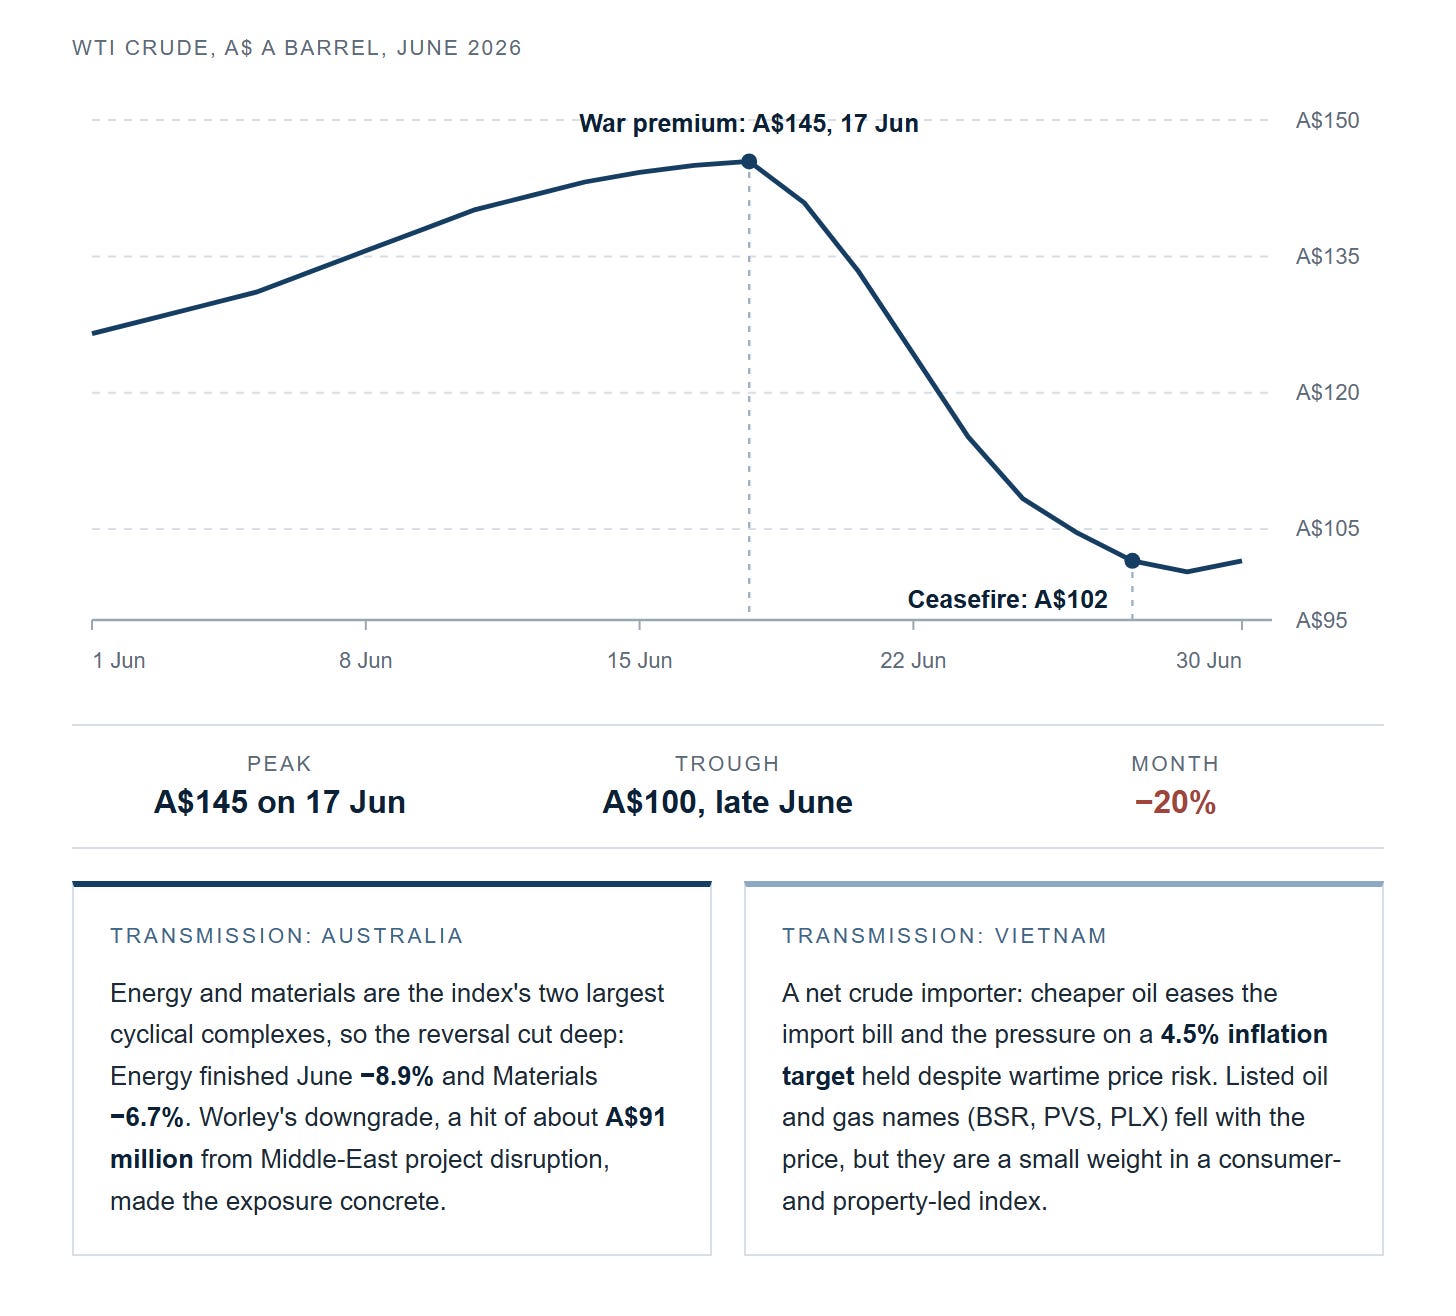
One round trip, two bills: the spike squeezed both markets, the break paid only the importer. Source: EIA front-month WTI pricing, converted at about US$0.66 per Australian dollar.
3. Neither rally was broad, and the buyers matter more than the print
The ASX’s flat month hides a hard rotation. Health Care rose 13.0% in June and still sits roughly 22% lower over the past year, while Consumer Staples and Consumer Discretionary added 12.0% each, Staples standing as the best ASX sector of 2026 so far at +16.7% (S&P Dow Jones Indices). Those gains netted against the resource complex, and with the broad middle of the index doing little, the headline settled at 0.6 percent.
Vietnam’s advance was narrower than its headline too. The final session is the one worth pausing on. On 30 June the index rose 5.04 points, and Vingroup-related shares contributed more than 6 points of it, VIC alone adding 4.7, so the rest of the market net-detracted. Breadth ran at 146 advancers to 148 decliners on turnover of VND 19.3 trillion (about A$1.1 billion, HOSE). Strip out the four Vingroup shares and HOSE’s index would sit at 1,747, about 2 percent below where it started the year (Việt Nam News).
Foreigners sold into all of it, and domestic investors absorbed the selling even as the index climbed. The outflow is not small: about A$4.5 billion of Vietnamese shares this year, from a group that now accounts for roughly 11.9 percent of trading on HOSE (HOSE, FiinGroup). The other side of the trade is structural: session turnover runs about 40 percent higher than a year earlier, almost all of it local. Profit-taking on a market up 31 percent over twelve months, into a firmer US dollar, meets a pool of local money deep enough to absorb it. Seller and buyer can both be right about the same tape.
June’s rally was funded by the buyers at home, not by foreign conviction. The gain is real. The base underneath it is narrow.
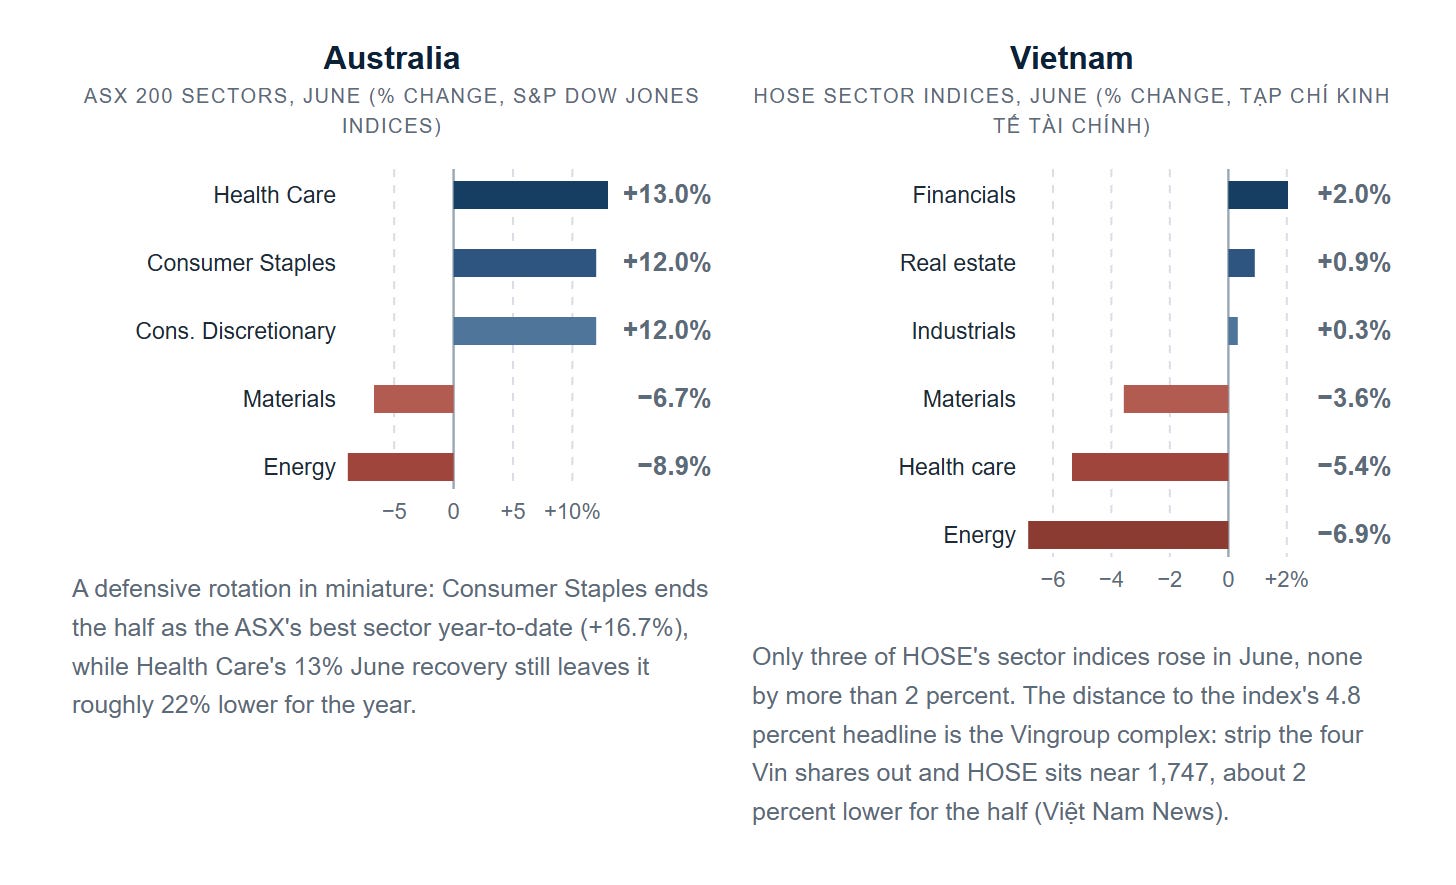
Australia’s June by sector beside Vietnam’s HOSE sector indices. Neither headline number came from a broad tape. Sources: S&P Dow Jones Indices, Tạp chí Kinh tế Tài chính, Việt Nam News.
4. Valuation loads the second half onto the sectors June punished
An allocator buying the ASX 200 in July is underwriting a commodity earnings recovery at 16.7 times forward earnings, against a long-run average of 14.9 times (consensus). The growth that premium rests on, +11.9% in FY26, comes mainly from materials and energy, the sectors June marked down hardest. Technology is roughly 2 to 3 percent of the index against about 30 percent for the S&P 500, a mix that spared Australia the AI drawdown in June and had denied it the AI rally before that. Behind the bet sit A$102 oil, an RBA holding at 4.35 percent after three hikes earlier in the year, and an IMF forecast for 2026 growth cut to 1.9 percent.
Stretch the window a quarter and the gap narrows: the ASX 200 rose 4.15 percent across Q2, nearly matching the VN-Index’s 4.2 percent for the entire first half, a quarter’s work against half a year’s. June’s divergence is real, but it is one month’s transmission of one shock, not a permanent spread.
Vietnam’s second-half case rests on growth and policy rather than an earnings forecast. A central bank has pledged support for production toward the government’s double-digit growth ambition, and the Q2 GDP print lands within days of this issue. Moody’s moved its outlook to positive in the spring. The counterweight is already visible: June’s gains leaned on a handful of megacaps while foreigners kept selling.
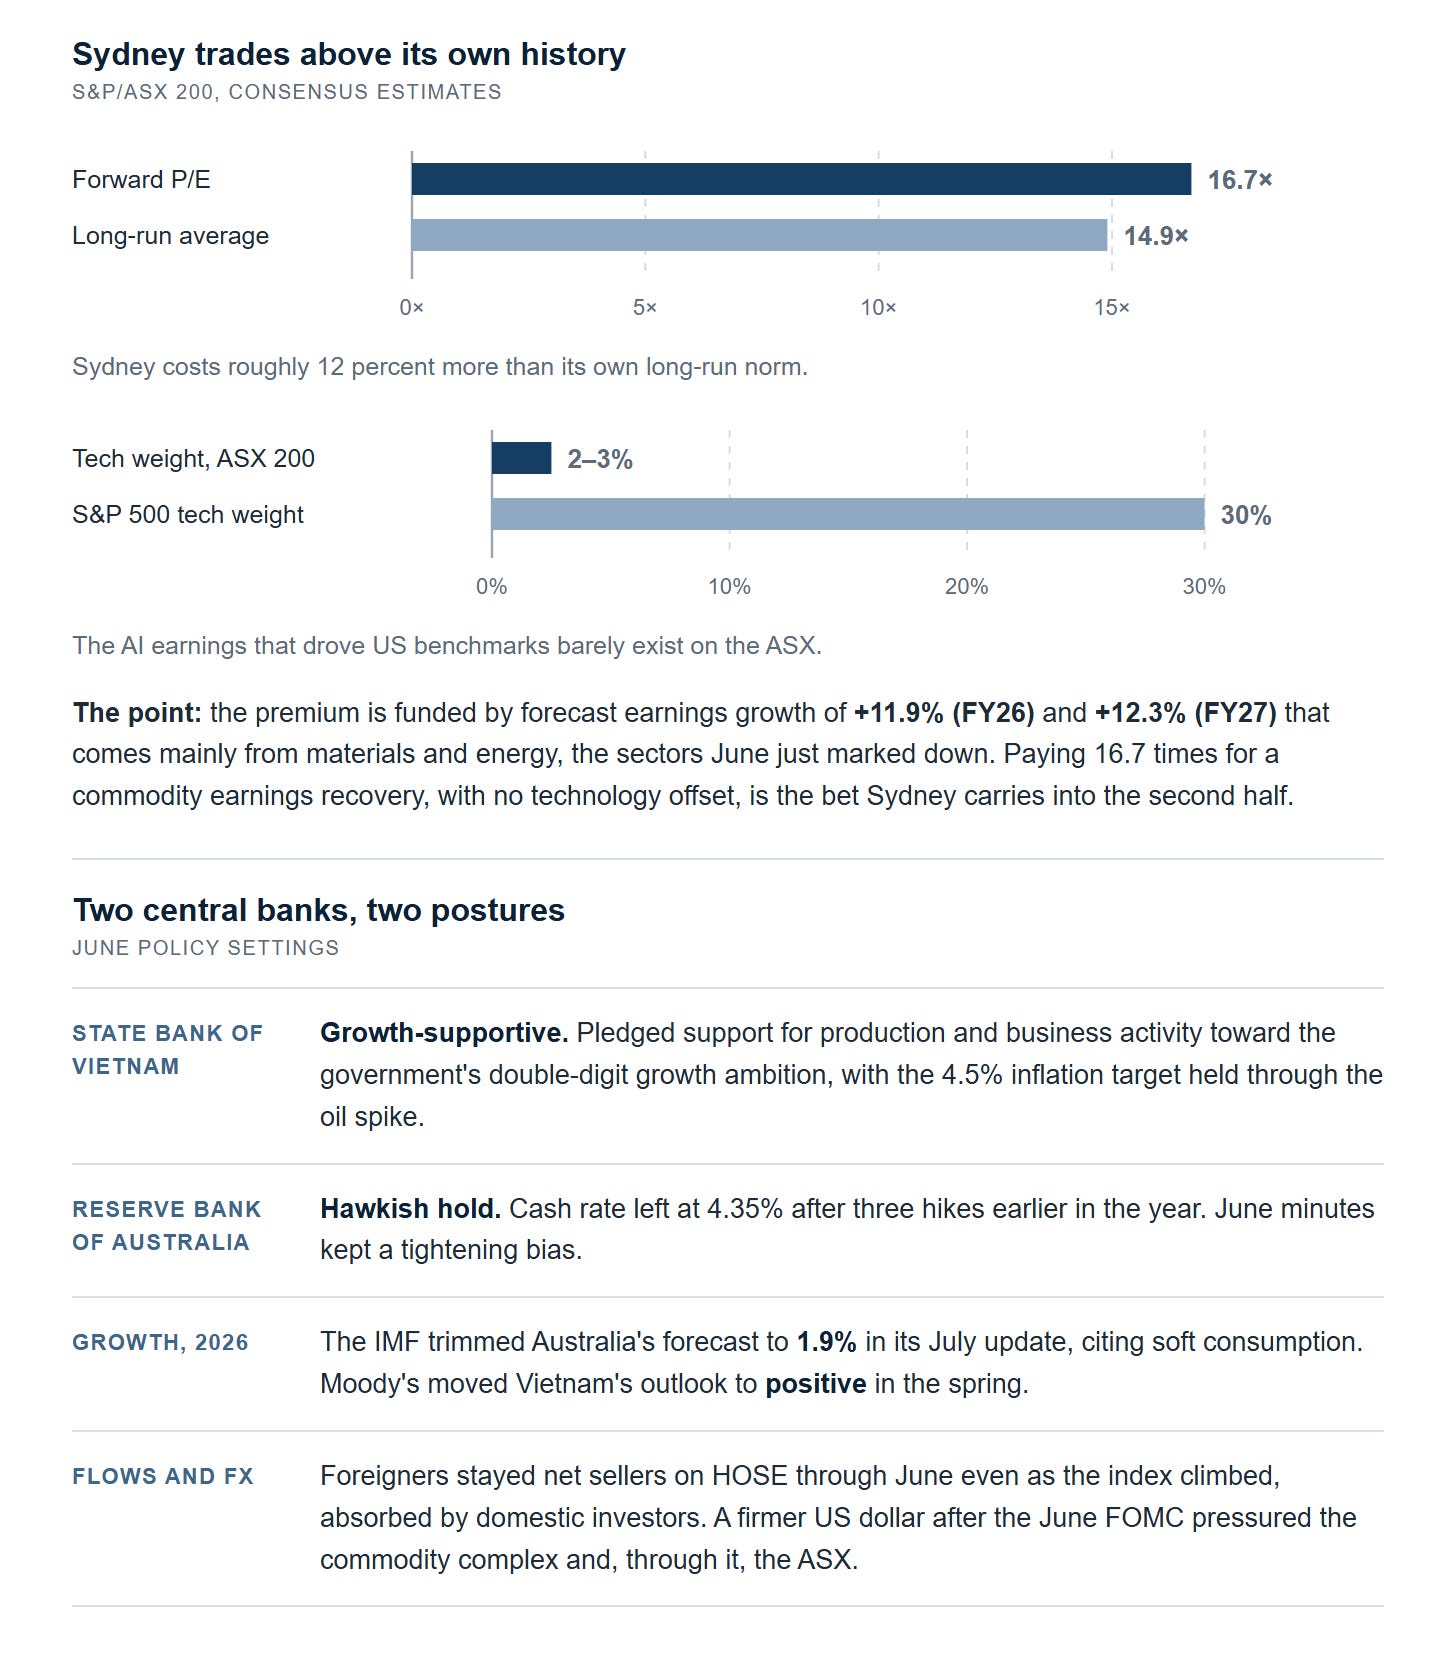
The ASX 200’s forward multiple against its own history, beside the June policy split. One index is priced for a commodity earnings recovery while its central bank leans against growth. Sources: S&P Dow Jones Indices consensus, RBA June minutes, State Bank of Vietnam, IMF.
5. What an allocator takes into July
Four items carry the second half. Vietnam’s Q2 GDP print, expected around 7.8 percent by consensus, is a test of what the local buying rests on. The RBA’s August meeting shows whether the hawkish hold survives the IMF’s softer growth numbers.
Breadth on HOSE has to widen, because a rally carried by one conglomerate is a rally one conglomerate can end. And the Hormuz reopening has to hold, because the ceasefire is all that separates A$102 oil from A$145 oil. On that last point the two markets stay mirror images. A broken ceasefire runs June in reverse.
If this was forwarded to you, it is free, and it arrives every second Sunday.
June was decided before a single stock was picked. Same war, same Fed, same barrel. Structure did not pick the year’s winner: it picked who got paid when one variable moved 20 percent. In June, it paid the importer.
General commentary only. Not financial product advice.
Sources: HOSE and S&P Dow Jones Indices index data. FiinGroup flow data. EIA front-month WTI pricing. State Bank of Vietnam. Reserve Bank of Australia (June minutes). IMF World Economic Outlook update (July 2026). Việt Nam News month-end HOSE recap. Tạp chí Kinh tế Tài chính (HOSE sector indices). Moody’s. Company disclosures (Worley, Judo Capital, Micron). Nasdaq (SpaceX listing). US dollar figures converted at about US$0.66 per Australian dollar. Figures as reported to 30 June 2026, except the IMF’s July update.